
GPU监控部署Grafana+Prometheus
本教程适用于内网以及具有网盘功能的服务器,公网服务器可直接在Prometheus中指定IP以及端口
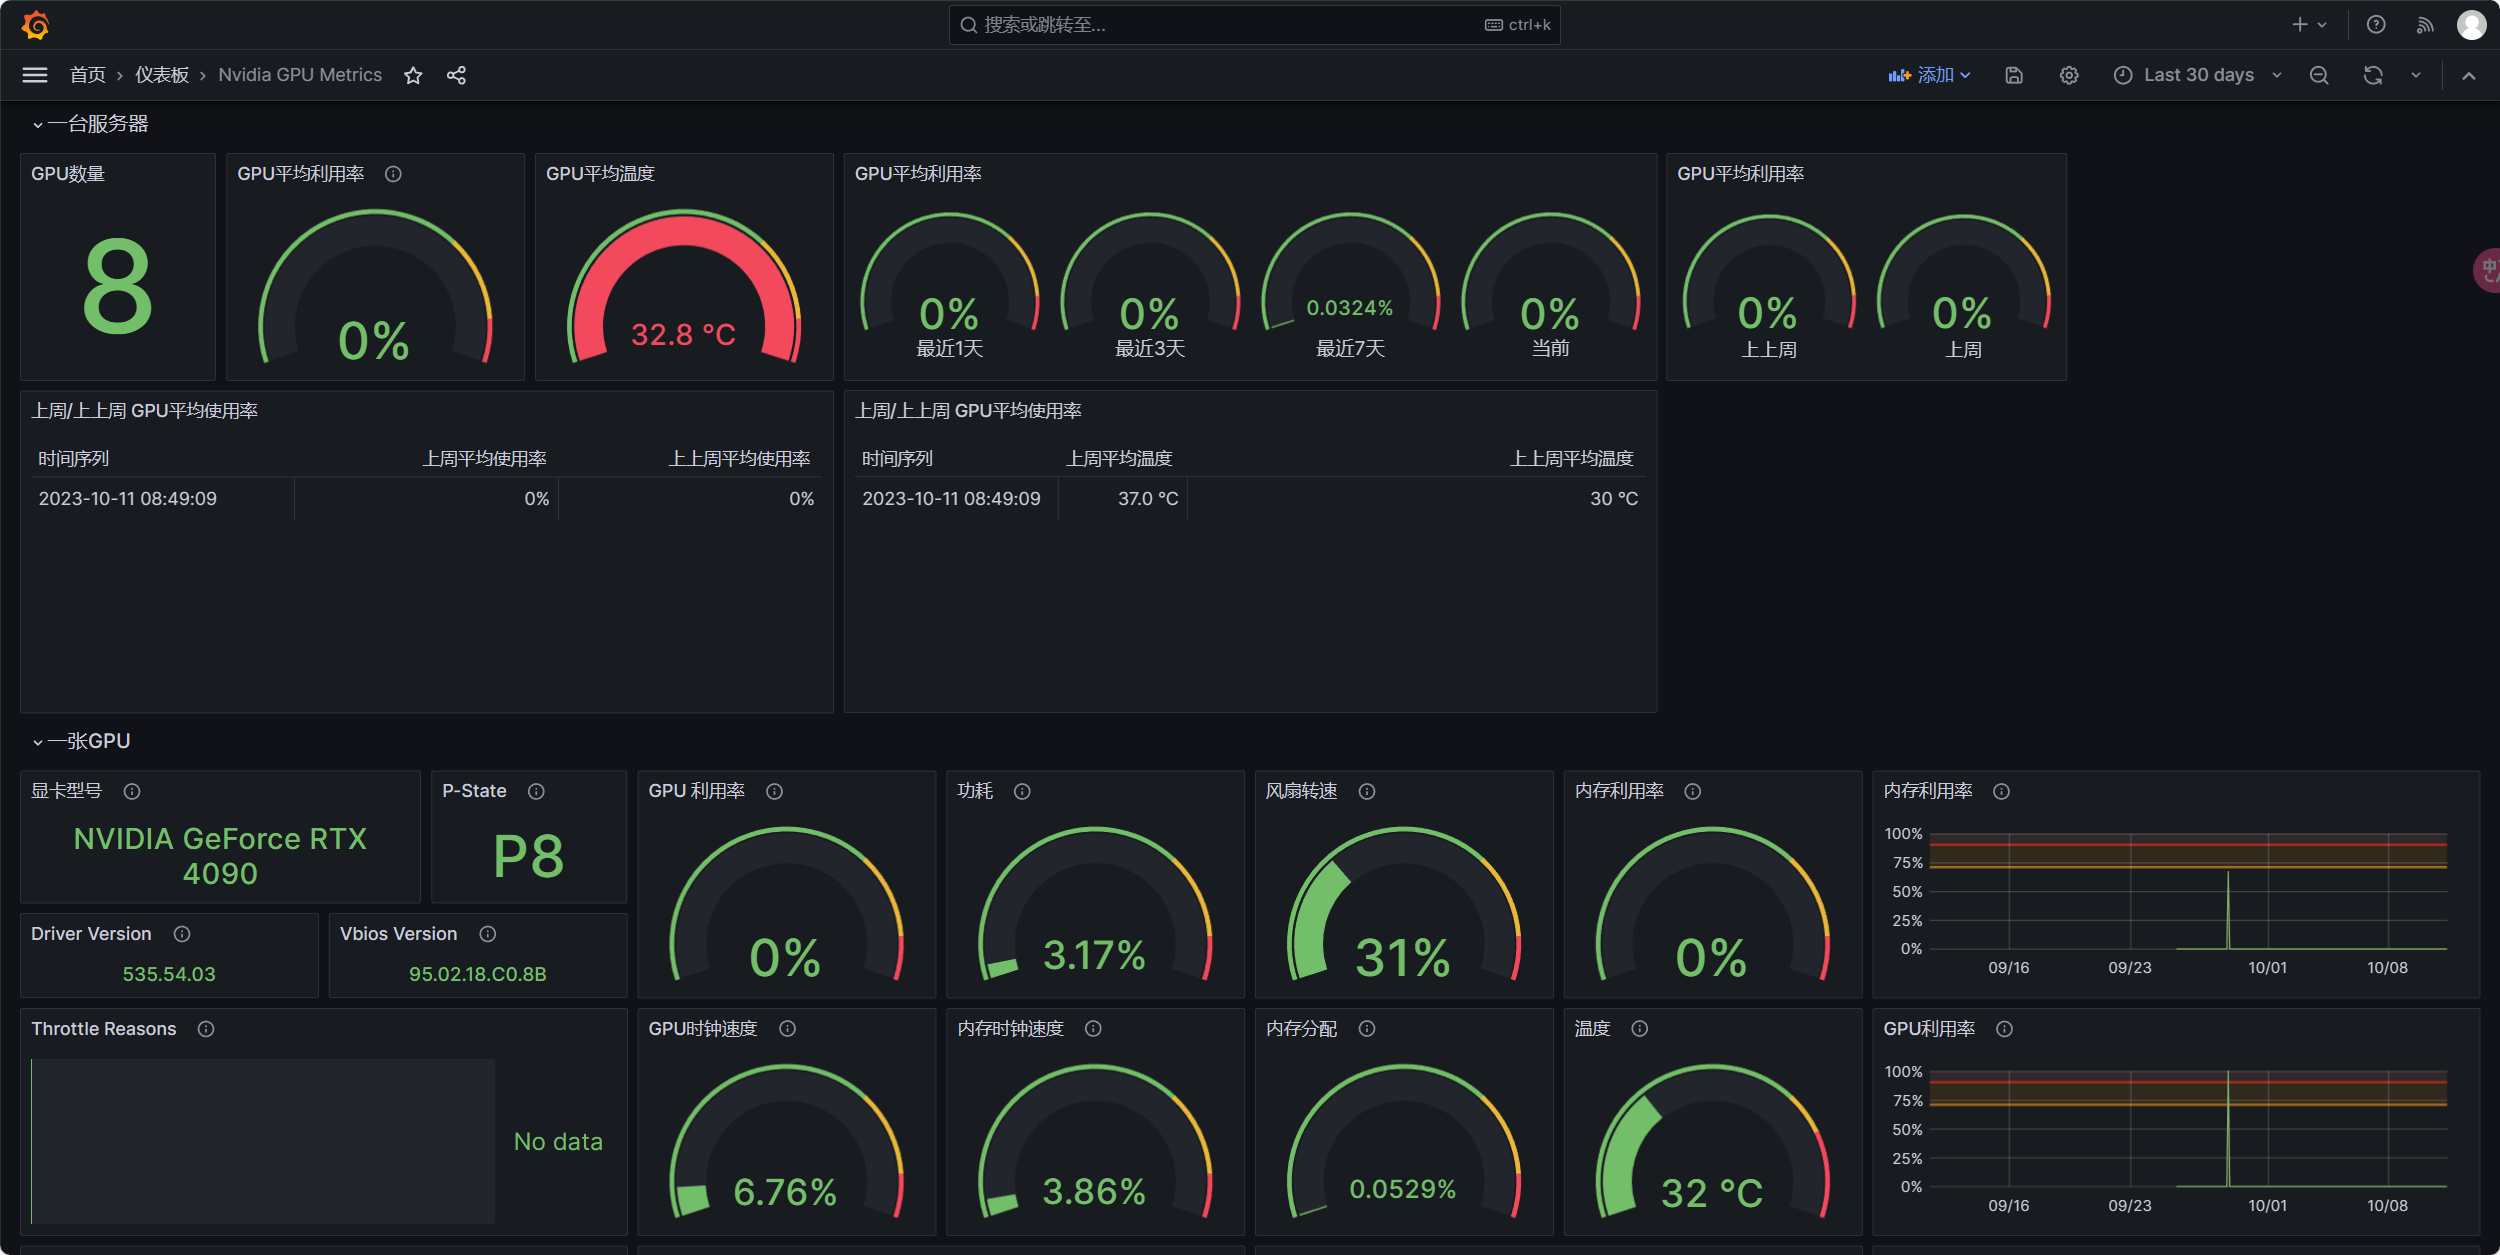
监控预览如下所示:
 服务端配置
服务端配置
根据操作系统类型关闭防火墙
ubuntu系统
ufw disablecentos系统
systemctl stop firewalld && systemctl disable firewalld && systemctl status firewalld创建监控目录
mkdir -p /etc/gpu/grafana
cd /etc/gpu/grafana选择对应版本安装Grafana监控:https://grafana.com/grafana/download?edition=enterprise
yum install -y https://dl.grafana.com/enterprise/release/grafana-enterprise-10.1.2-1.x86_64.rpm参考链接安装Mysql:Centos7安装Mysql8 - isunty
进入数据库,创建了一个名为“grafana”的新数据库,并设置其默认字符集为utf8和默认排序规则为utf8_general_ci
mysql -uroot -p
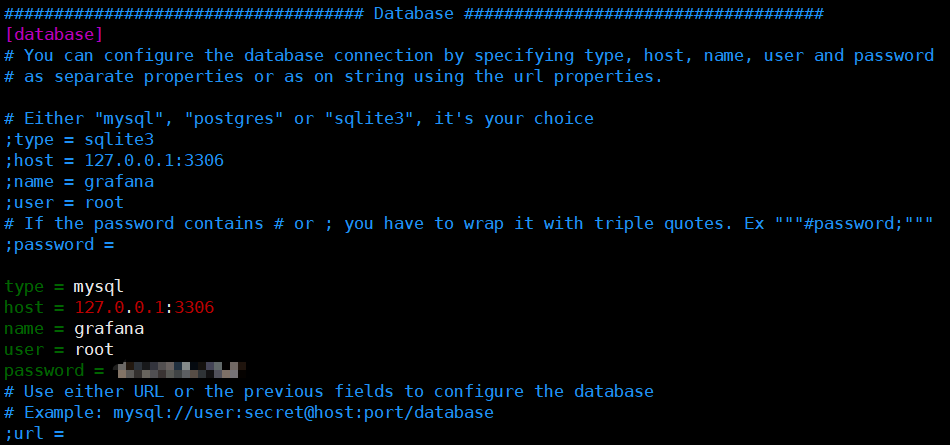
CREATE DATABASE grafana DEFAULT CHARACTER SET utf8 COLLATE utf8_general_ci;在文件/etc/grafana/grafana.ini中修改数据库信息以及其他信息
 启动监控服务
systemctl restart grafana-server && systemctl enable grafana-server && systemctl status grafana-server监控平台地址为服务器的IP:http://174.1.9.1:3000/
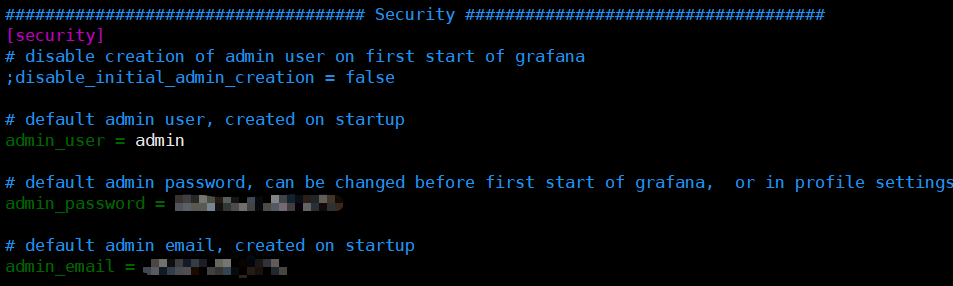
默认账号密码都为:admin
若想自定义Grafana配置可在文件/etc/grafana/grafana.ini中修改
 选择对应版本安装Prometheus:https://prometheus.io/download/
解压包
tar -xvzf prometheus-2.47.0.linux-amd64.tar.gz移动至目录/etc/gpu/grafana
mv prometheus-2.47.0.linux-amd64 /etc/gpu/grafana/prometheus修改Prometheus配置文件
cd /etc/gpu/grafana/prometheus && vim prometheus.yml
- job_name: 'prometheus'
static_configs:
- targets: ['192.168.196.216:30000']
labels:
instance: xxxx_gpu005
attribution: test
- targets: ['192.168.196.216:30001']
labels:
instance: xxxx_gpu006
attribution: test创建监控的logs目录
mkdir /etc/gpu/grafana/prometheus/logs编辑项目启动脚本
cd /etc/gpu/grafana/prometheus && vim start.sh
#!/bin/bash
./prometheus &> logs/log.log&
chmod 700 start.sh && ./start.shPrometheus地址为服务器的IP:http://174.1.9.1:8090/
创建监控数据保存目录
mkdir -p /etc/gpu/grafana/data/ycsc配置下载数据脚本
cd /etc/gpu/grafana && vim downloadtxt.sh
#!/bin/bash
while true; do
rclone copy ycsc:/grafana/data/xxxx/xxxx_gpu005.txt /etc/gpu/grafana/data/xxxx/ >/dev/null 2>&1
rclone copy ycsc:/grafana/data/xxxx/xxxx_gpu006.txt /etc/gpu/grafana/data/xxxx/ >/dev/null 2>&1
sleep 5
done
chmod 700 downloadtxt.sh安装python相关软件
yum install python-pip
pip3 install Flask -i https://pypi.tuna.tsinghua.edu.cn/simple --trusted-host pypi.tuna.tsinghua.edu.cn --no-cache-dir --disable-pip-version-check
配置端口数据服务
vim portconf.py
# coding=utf-8
from flask import Flask, send_file, request
import threading # 导入 threading 模块
app = Flask(__name__)
# 定义文件名和端口的映射关系
file_port_mapping = {
30000: '/etc/gpu/grafana/data/xxxx/xxxx_gpu005.txt',
30001: '/etc/gpu/grafana/data/xxxx/xxxx_gpu006.txt',
}
# 创建一个锁以确保线程安全
lock = threading.Lock()
# 定义一个路由,该路由将提供纯文本文件
@app.route('/metrics')
def serve_text_file():
port = None
filename = None
with lock:
# 获取当前请求的端口号
port = int(request.environ.get('SERVER_PORT'))
# 根据端口号查找文件名
if port in file_port_mapping:
filename = file_port_mapping[port]
if filename is None:
return 'File not found', 404
# 使用Flask的send_file函数提供文件
return send_file(filename)
if __name__ == '__main__':
# 使用多线程启动多个Flask应用程序
for port, filename in file_port_mapping.items():
app_thread = threading.Thread(target=app.run, args=('174.1.7.3', port))
app_thread.start()
chmod 700 portconf.py添加自动化脚本
vim /etc/gpu/grafana/auto.sh
#!/bin/bash
start() {
echo "Starting services..."
/bin/bash -c "nohup bash /etc/gpu/grafana/downloadtxt.sh > /dev/null 2>&1 &"
/bin/bash -c "nohup bash -c 'cd /etc/gpu/grafana/prometheus && bash start.sh' > /dev/null 2>&1 &"
/bin/bash -c "nohup python /etc/gpu/grafana/portconf.py > /dev/null 2>&1 &"
echo "Services started."
}
stop() {
echo "Stopping services..."
pkill -f /etc/gpu/grafana/downloadtxt.sh && pkill -f /etc/gpu/grafana/portconf.py && pkill prometheus && pkill -f /etc/gpu/grafana/prometheus/start.sh
echo "Services stopped."
}
status() {
echo "Checking services status..."
if pgrep -f /etc/gpu/grafana/downloadtxt.sh && pgrep -f /etc/gpu/grafana/portconf.py && pgrep prometheus; then
echo "All services are running."
else
echo "Some services are not running."
fi
}
case "$1" in
start)
start
;;
stop)
stop
;;
status)
status
;;
*)
echo "Usage: $0 {start|stop|status}"
exit 1
;;
esac
exit 0启动/停止/查看服务
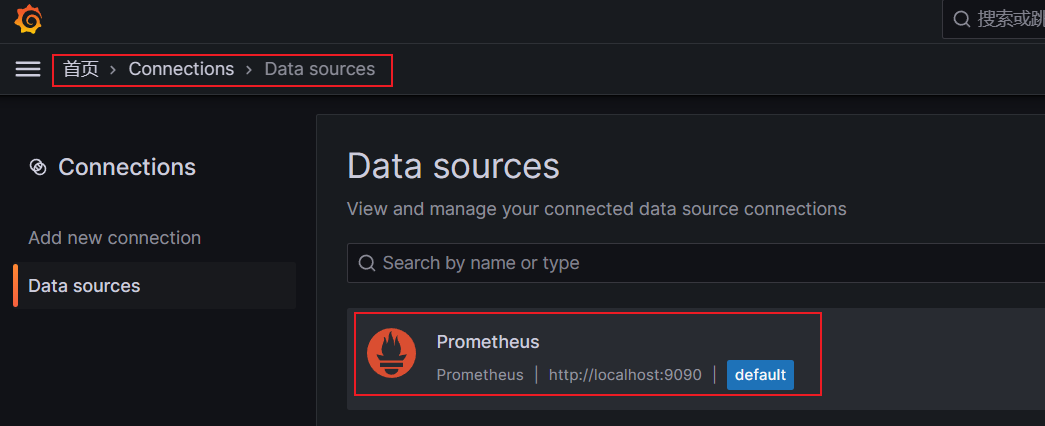
./auto.sh start访问grafana配置Prometheus数据源地址
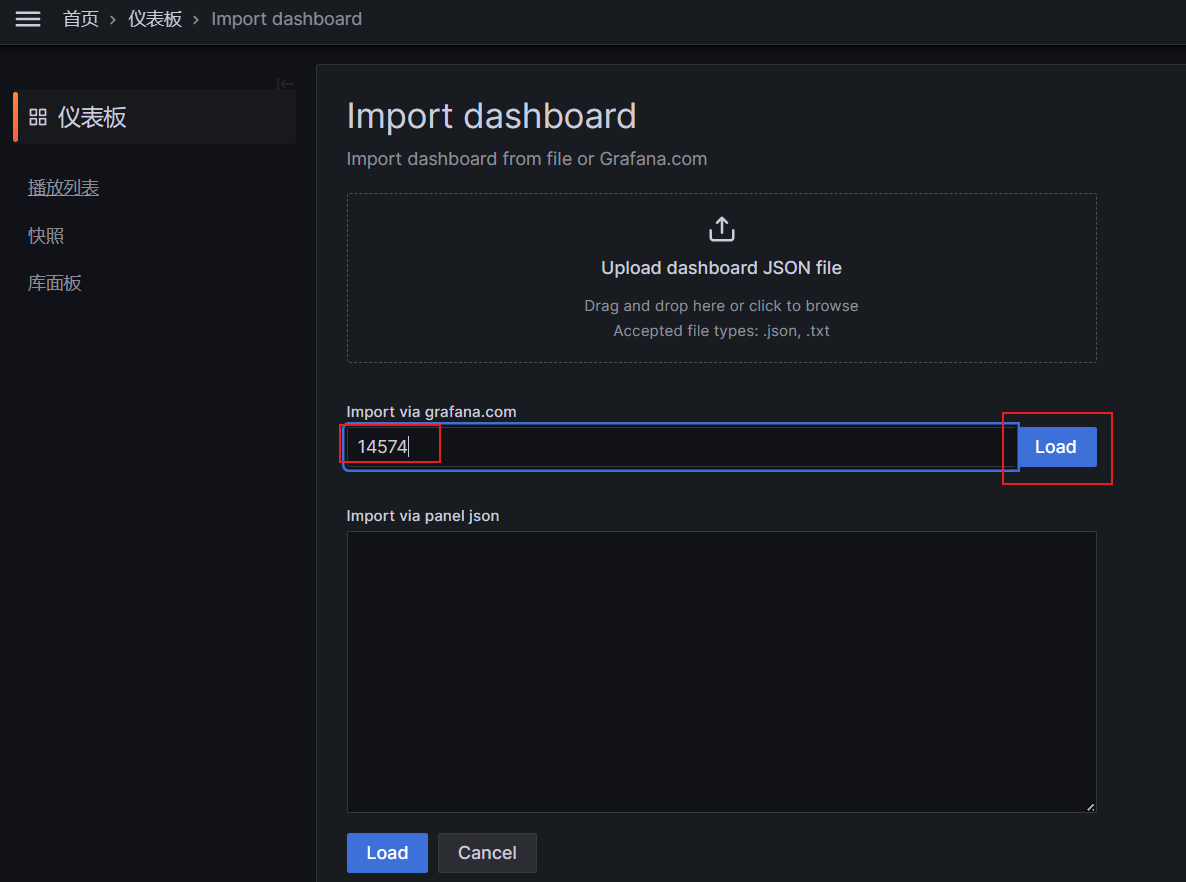
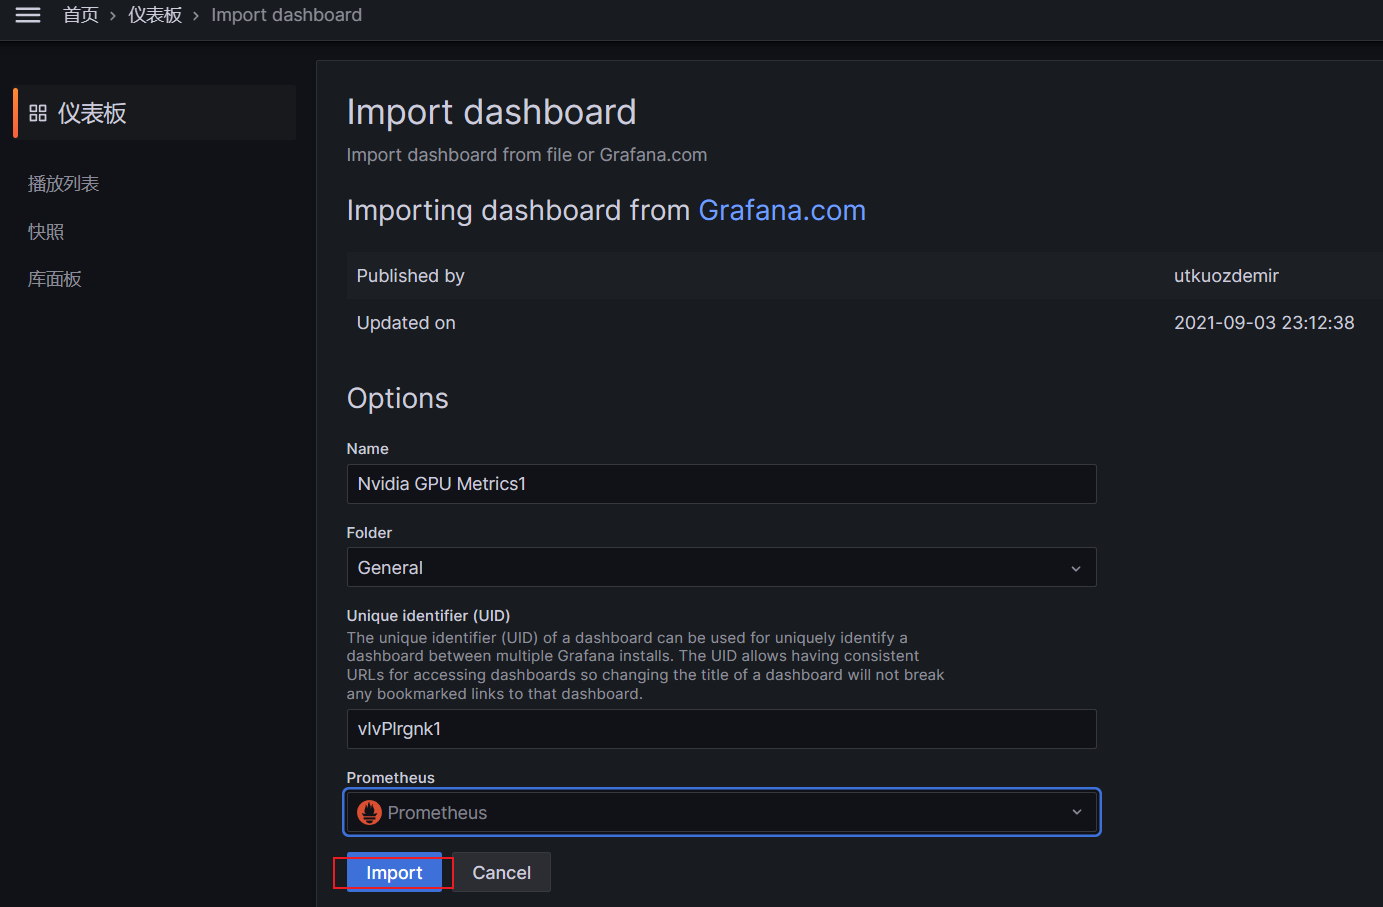
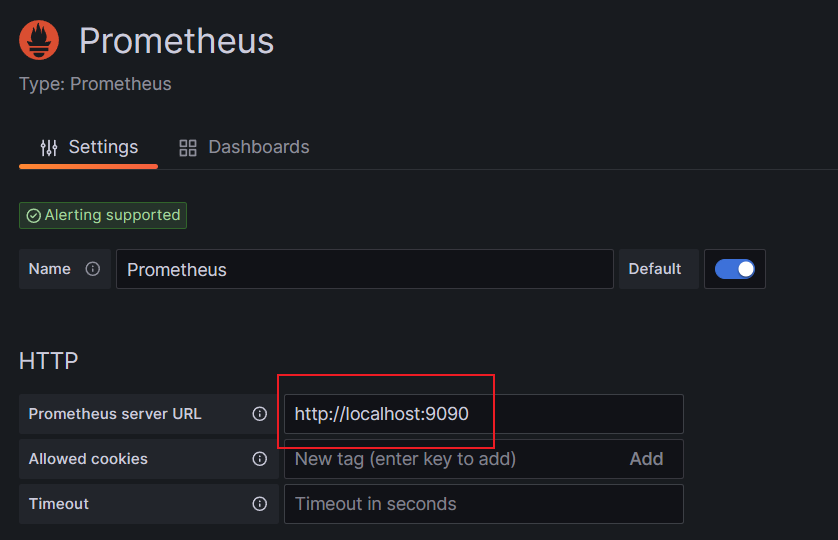 导入数据至监控

 客户端配置
客户端配置
根据操作系统类型关闭防火墙
创建监控目录
mkdir -p /etc/gpu/grafana
cd /etc/gpu/grafana下载nvidia_gpu_exporte然后将其传输至服务器的监控目录,下载链接:https://github.com/utkuozdemir/nvidia_gpu_exporter/tags
tar -xvzf nvidia_gpu_exporter_1.1.0_linux_x86_64.tar.gz
mv nvidia_gpu_exporter /usr/bin
安装网盘
curl https://rclone.org/install.sh | bash
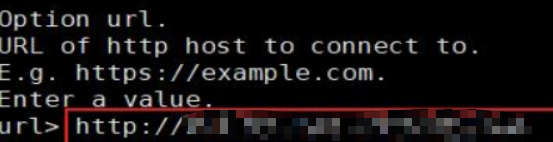
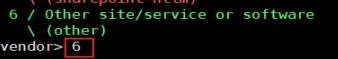
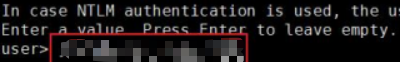
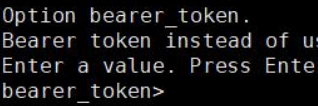
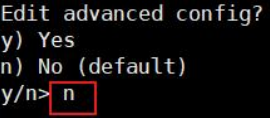
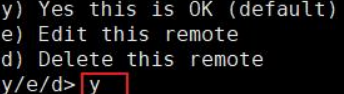
rclone config若执行不成功则使用一下办法
wget https://downloads.rclone.org/v1.63.0/rclone-v1.63.0-linux-amd64.zip
unzip rclone-v1.63.0-linux-amd64.zip
cd rclone-v1.63.0-linux-amd64/
chmod +x rclone
mv rclone /usr/bin
rclone config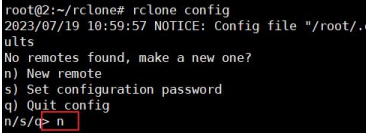
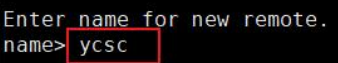

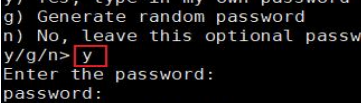 直接回车
直接回车
 编辑脚本,并将以下内容中的路径更改为对应文件名
cd /etc/gpu/grafana && vim auto.sh
#!/bin/bash

while true; do
    curl -s http://localhost:9835/metrics > /etc/gpu/grafana/xxxx_gpu005.txt 2>&1
    rclone copy /etc/gpu/grafana/xxxx_gpu005.txt ycsc:/grafana/data/xxxx/xxxx_gpu005.txt  >/dev/null 2>&1
    sleep 10
done
chmod 700 auto.sh如果采用代理上网则需要将命令curl -s http://localhost:9835/metrics > /etc/gpu/grafana/xxxx_gpu005.txt 2>&1 修改为 curl -sS --noproxy "*" http://localhost:9835/metrics > /etc/gpu/grafana/xxxx_gpu005.txt
根据操作系统选择对应步骤
配置监控守护进程(Ubuntu)
vim /etc/systemd/system/nvidia_gpu_exporter.service
[Unit]
Description=Nvidia GPU Exporter
After=network-online.target
[Service]
Type=simple
User=root
Group=root
ExecStart=/usr/bin/nvidia_gpu_exporter
SyslogIdentifier=nvidia_gpu_exporter
ExecStartPost=/bin/bash -c '/etc/gpu/grafana/auto.sh &'
ExecStop=/bin/bash -c 'pkill -f /etc/gpu/grafana/auto.sh'
Restart=always
RestartSec=1
[Install]
WantedBy=multi-user.target
systemctl daemon-reload && systemctl restart nvidia_gpu_exporter && systemctl enable nvidia_gpu_exporter && systemctl status nvidia_gpu_exporter配置监控守护进程(Centos)
vim /etc/systemd/system/nvidia_gpu_exporter.service
[Unit]
Description=Nvidia GPU Exporter
After=network-online.target
[Service]
Type=simple
User=root
Group=root
ExecStart=/usr/bin/nvidia_gpu_exporter
SyslogIdentifier=nvidia_gpu_exporterd
ExecStop=/bin/bash -c 'pkill -f /etc/gpu/grafana/auto.sh'
Restart=always
RestartSec=1
[Install]
WantedBy=multi-user.target
systemctl daemon-reload && systemctl restart nvidia_gpu_exporter && systemctl enable nvidia_gpu_exporter && systemctl status nvidia_gpu_exporter